SESNY Keynote: Business Optimization in a Digital Age with Avinash Kaushik
Mike Grehan welcomes the crowd. He offers apologies for the intermittent problem with the microphone. Every once in a while it causes the speaker to sound like he has a British accent. ;)
 He mentions it’s the first day of spring! He says today’s Google doodle features a zebra. This connection he does not understand.
Before our featured speaker, let’s hear a presentation from Dr. Edel Garcia, Sr. Researcher, Minerazzi Project, Microsoft Innovation Center of Pureto Rico. He’s going to explain new research: the Self-Weighting Model (SWM) for conducting meta analysis and applications to SEO/SEM correlation studies.
The Hunter-Schmidt and Hedges-Olkin models for meta-analysis can fail. This new model (SWM) has no sample size issues, n oadditivity issues, no statistics type issues and no distribution issues. Unfortunately, this is all over my head so I’m unable to explain the diagrams and illustrations that helped explain this research. So you’re going to have to read the research paper yourself:
Garcia, E. (2012). The Self-Weighting Model. Communications in Statistics – Theory and Methods, 41:8.
Now to the keynote with Avinash. Avinash is Google’s digital marketing evangelist. If that doesn’t earn him the designation of guru, then what would?
“Information is powerful. But it is how we use it that will define us.”
He’s going to explain his perspective of how to do more with what we have access to. We don’t have to be in a hording mindset of getting more data.
There are overlapping circles: influence, experience and value. He tends to live in the intersection of the three. Some people like the venn diagram to be labeled: marketing, magic and money. He’s okay with that too.
 Embrace Economic Value
…understand and solve for 100%.
Of the top 50 e-commerce websites, conversion rate is 2%. We measure everything for this 2% and end up optimizing for this 2%. What about all the rest of the people we work hard to get through the door. We need to solve for the rest of the people and let them give value to the company.
Obsess about the one big thing your boss cares about – conversion, direct revenue. This is the macro conversion.
But also think about the other possibilities available. What are they? If people didin’t jump into bed with us right away? Is there anything we can extrapolate and use 2 weeks later? These are the micro conversions.
Rarely do we understand the complete view of what digital contributes to our value.
Rock: The Strategic
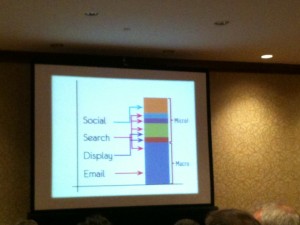
None of us optimize for just one thing or the other. We invest in many things: social, search, display, email…
Don’t cut out channels because you don’t see them driving macro conversions. It’s like cutting off your legs to run faster.
Intelligent Attribution Modeling
…understand, be less wrong.
Some users may come in through Google and buy. Straightforward attribution.
Some may search Yahoo, leave, find an affiliate code, come back and buy. More complicated attribution.
How can you optimize digital marketing budget with a more sophisticated approach?
1. Understand How You’re Doing Today.
The problem you face is that there’s a lot of data. How do you understand 18k rows of data. It’s not the fault of people who use data? It’s the fault of vendors who create data pukes.
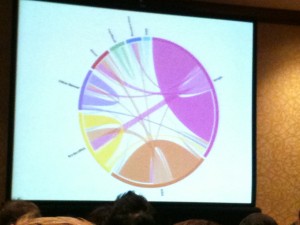
Core diagram lets you see how any one particular channel creates an outcome for your brand. First and last touchpoints are visualized along with lines connecting interactions between channels.
How to make that diagram: create custom grouping of channels, dump it into Excel, then boom.
http://zqi.me/vizd3 <- Create these visualizations yourself!
You can see there are channels more likely to convert after last click. Other channels’ jobs are for pushing toward other channels.
2. Apply Optimal Attribution Model.
There have been attempts at giving credit to channels, like the last click model, equal credit model, the time decay model. The “personalized to your business”, which Avinash calls the MCU (Make Crap Up) model, he sees growing in popularity with agencies. If you create your own custom model, remember that these are just a handful of many variables to consider.
Measure –> value –> test (and back around)
Understand, test, be less wrong – that’s the best model you can do.
Influence, Evolves!
People are talking amongst themselves. The arrows have moved from one direction (traditional marketing is like yelling over a megaphone) to bi-direction when we listen to who users are (Internet marketing) to multi-directional where users are talking to each other, too (social web marketing).
Social sucks today because we’re measuring dumb things like what time you tweet.
Instead, do 3 crucial things.
1. Ground your understanding in: So What? What’s the economic value delivered in social channel. Find the indirect value of social. There will be no debate over the value of a fan, a follower on Twitter.
2. From where are all these things happening? Discover your off-site activity. Correlate overall traffic and social traffic and identify what you’re doing on social that’s causing traffic to come back.
3. Why?! This will bring you back to the people causing economic value to be created. Why are people +1ing and liking…
New social analytics section inside Google Analytics as of today! It grounds actions to discussions outside your site.
Multi-Channel Portfolio Optimization
…controlled experiments rock!
This is the only way you can become really sophisticated. Send only a catalog to some users, only emails to others and emails and catalogs to others. This is an online/offline test, but it can be used between any channels.
Do online searches drive in-store conversions? There was a test.
Test details: 4 weeks
Structure: 11 test markets (128 stores)
39 control markets (621 stores)
Outcomes: $1 spent in paid search drove $15 purchase
22% contribution margin (this is mindblowing – you’re usually lucky to crack 3%)
1. Move away from being data pukers, to hiring ninjas with these skills: scientific method, design experiments, data analysis
2. Always on – constantly experimenting. Use 10% of budget to test.
Line of Sight Framework
What are we doing to improve the 4 important things:
Price, cost, marketing share, market size
Evaluate your strategies and KPI in those areas. Without this line of sight about why you’re solving for what you’re solving for, it will be very hard to find success.
The final lessons:
1. Measure holistic success
2. Figure out intelligent-er attribution
3. Rethink social (so what, where, why)
4. Stop guessing – controlled experiments
5. Insane focus – have a clear line of sight

LEAVE A REPLY


