Web Usage Guessing Game — SEM Synergy Extras
Today’s episode of SEM Synergy, our weekly Internet marketing podcast / industry lovefest, was a blast. As usual.
Quick highlights? Guest Steve Plunkett illustrates Foursquare gripes care of Hooters. Jessica makes her show debut. And Susan predicts the whole Internet thing is a passing fad. :D [SEO is dead! Newspapers are the way of the future! —Susan] Care to tune in?
Oh. You’re not easily seduced by non sequitur teasers and orange hot pants? Wow. Tough crowd, but you’re right. I owe you more than that. I owe you some nitty gritty. It’s time to get a dirty in Web data.
Web Usage Shifts
Bruce, Susan and I started the show discussing Web usage trends. Internet users are now spending around 22 percent of their online time on social networks. Online video viewing has reached an all-time high. And time spent online is rising and falling, depending on what metric you’re looking at.
Regarding the last point, I’ve pulled together some data from Nielsen Company on the average Internet usage in the U.S. for January, February, March, April and May of 2010.
Examining the Evidence
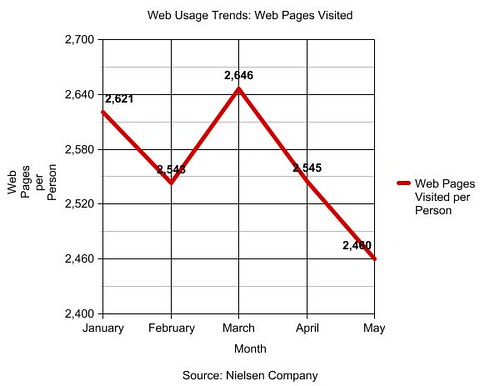
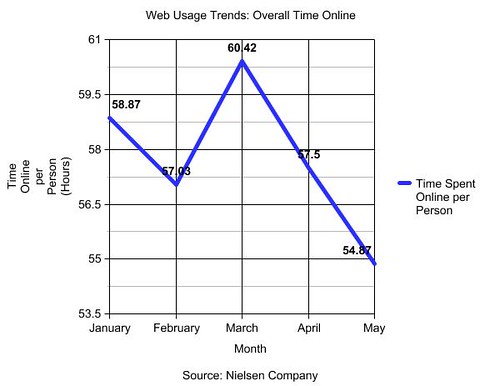
Here are charts I created to visualize the data. (Note: If you compare the Nielsen reports linked to above to the data on the chart, you may find inconsistencies. There were occasions where the figure reported for a month was different in the following month’s “previous month” column. In these cases, I opted to use the following month’s “previous month” data with the logic that numbers may have been refined as more data is made available.)
 |
 |
 |
 |
So basically, people are firing up a Web browser a little more than they did at the beginning of the year; the number of different sites a user visits in a month seems to be fluctuating; the number of individual pages a user visits in a month is dropping, and so is the overall amount of time spent online.
Now take a look at those last two graphs. I’m no scientist, but is there some kind of correlation between the fewer numbers pages visited and the lessening amount of time spent online? This brings up a chicken-or-the-egg problem: are people A) spending less time online because they’re visiting fewer pages, or B) visiting fewer pages because they’re spending less time online? To narrow down these options, I considered the first and second graphs. People are hopping online more often now than in January. At the same time, the number of different sites they’re visiting is all over the board. With these additional pieces of info, I’m leaning toward hypothesis A. People are going online more, visiting more or less the same number of sites, and yet they’re not visiting as many pages, leading to a decrease in overall time spent. So why the fewer number of pages visited?
Theories Off the Top of My Head
Less Searching: There’s no question that Internet users are becoming increasingly savvy. So it stands to reason that they may be doing fewer searches as they’re better at finding what they’re looking for. This could be because:
- Their queries start out more targeted so they do fewer refining searches.
- They’re better at recognizing the most relevant result in the SERP.
- They’re less likely to use the search bar as navigation.
- Search engines are continuing to improve the relevance of results with blended search and personalization.
On the other side of the coin, as sites become more optimized and evolved, the number of searches performed may decline. This could be because:
- The results displayed in SERPs may be more likely to satisfy a searcher’s need.
- The answer is displayed in the SERP itself, either called out by the engine or in a result page’s description.
- Fewer searches are required thanks to Sitelinks.
- Social media is answering questions before a search is needed.
Mobile Surfing: I’m not experienced in Web analytics, but does time spent in a mobile app get counted in Web usage data? Like, when I’m using the LA Times shiny new iPhone app, is that time being counted by the folks at Nielsen? If I’m reading my news feed on Facebook’s app, can Compete.com see that?
Furthermore, when I’m using a Twitter app on my smartphone, I’m following links and bouncing around to lots of different domains, but I’m not digging into the site or viewing multiple site pages. Actually, my behavior on my phone looks a whole lot like those four graphs above. Overall, I’m going online more than ever because the Internet is in my pocket. However, my sessions are shorter and my visits to sites are bouncier — I’m just visiting one page, usually through a link on Facebook or Twitter, and then leaving.
Of course, no one really knows what’s at the bottom of the Web usage mystery, so why not make a game of it? It’ll be like Clue! I’ll start. I suspect adult Internet users visiting links from Twitter with mobile phones. Your turn!

LEAVE A REPLY


