--%3E%3Csvg version='1.1' id='_x3C_Layer_x3E_' xmlns='http://www.w3.org/2000/svg' xmlns:xlink='http://www.w3.org/1999/xlink' x='0px' y='0px' viewBox='0 0 234.24 234.24' style='enable-background:new 0 0 234.24 234.24;' xml:space='preserve'%3E%3Crect x='0.029' y='0.008' style='fill:%231972B9;' width='234.24' height='234.24'/%3E%3Cg%3E%3Cg%3E%3Cpath style='fill:%23FFFFFF;' d='M24.3,63.466l-0.268-0.235v-1.679l0.268-0.235c3.828,0.179,6.782,0.269,8.865,0.269 c0.782,0,5.315-0.09,10.734-0.269c1.745-0.044,3.009-0.066,3.794-0.066c3.023,0,5.417,0.301,7.186,0.905 c1.769,0.605,3.189,1.673,4.264,3.208c1.074,1.533,1.612,3.274,1.612,5.221c0,2.485-0.895,4.791-2.686,6.916 c-1.791,2.128-4.7,3.65-8.729,4.568c2.417,0.223,4.41,0.549,5.977,0.972c1.566,0.425,2.921,1.08,4.061,1.966 c1.142,0.884,2.043,2.03,2.704,3.44c0.66,1.41,0.991,3.045,0.991,4.904c0,1.454-0.225,2.933-0.672,4.433 c-0.448,1.498-1.27,2.987-2.468,4.466c-1.198,1.476-2.646,2.742-4.348,3.793c-1.701,1.052-3.441,1.815-5.222,2.283 c-1.78,0.47-3.99,0.705-6.631,0.705c-0.537,0-3.582-0.056-6.268-0.168c-2.979-0.067-4.59-0.099-4.835-0.099 c-1.523,0-3.393,0.088-5.608,0.267l-0.269-0.267v-1.109l0.269-0.334c1.298-0.583,2.048-0.986,2.249-1.21 c0.201-0.222,0.365-2.205,0.488-5.942c0.123-3.74,0.185-6.594,0.185-8.564V79.281l-0.034-7.622c0-1.657-0.022-3.006-0.067-4.046 c-0.045-1.042-0.106-1.785-0.185-2.234c-0.077-0.446-0.206-0.761-0.385-0.94s-0.431-0.329-0.756-0.453 c-0.324-0.123-0.878-0.229-1.662-0.32L24.3,63.466z M36.355,81.095c1.119,0.09,2.384,0.135,3.795,0.135 c4.633,0,9.289-0.828,11.103-2.486c1.813-1.656,2.719-3.929,2.719-6.815c0-1.679-0.347-3.106-1.042-4.283 c-0.693-1.174-1.785-2.076-3.274-2.702c-1.488-0.628-4.941-0.942-7.493-0.942c-2.081,0-3.918,0.169-5.507,0.504 c-0.202,2.015-0.302,5.529-0.302,10.543V81.095z M36.422,105.573c1.724,0.403,3.493,0.604,5.305,0.604 c3.2,0,7.142-0.515,8.954-1.543c1.814-1.031,3.15-2.458,4.013-4.283c0.861-1.825,1.293-3.811,1.293-5.96 c0-3.223-0.911-5.802-2.736-7.739c-1.824-1.937-7.202-2.904-13.27-2.904c-1.007,0-2.216,0.044-3.626,0.133v11.452L36.422,105.573z '/%3E%3Cpath style='fill:%23FFFFFF;' d='M68.331,108.914v-1.589l0.44-0.325l0.108-0.004c1.568-0.066,2.622-0.15,3.133-0.246 c0.632-0.119,0.837-0.253,0.895-0.307c0.055-0.048,0.197-0.225,0.324-0.827c0.106-0.491,0.168-1.636,0.185-3.404l0.026-5.311 v-11.66l-0.052-4.907c-0.015-1.887-0.063-3.117-0.137-3.656c-0.09-0.655-0.223-0.862-0.274-0.921 c-0.063-0.071-0.248-0.213-0.757-0.342c-0.299-0.078-1.123-0.185-3.342-0.267l-0.125-0.004l-0.425-0.366V73.19l0.439-0.375 l0.14,0.006c3.115,0.133,5.572,0.202,7.305,0.202c1.922,0,4.555-0.06,7.822-0.176c1.224-0.035,2.109-0.05,2.659-0.05 c4.473,0,7.438,0.792,9.065,2.421c1.604,1.608,2.417,3.54,2.417,5.744c0,1.464-0.395,2.921-1.177,4.327 c-0.778,1.406-1.941,2.622-3.455,3.615c-1.397,0.915-3.3,1.627-5.661,2.121c0.506,0.674,1.256,1.654,2.254,2.938l3.649,4.736 c1.182,1.562,2.449,3.208,3.799,4.946c1.728,2.22,2.318,2.742,2.516,2.857c0.357,0.204,0.659,0.33,0.9,0.374 c0.259,0.046,0.693,0.068,1.285,0.068h0.146l0.418,0.41v1.484l-0.463,0.453l-0.171-0.021c-0.804-0.099-1.775-0.15-2.885-0.15 c-1.203,0-2.533,0.05-3.956,0.151l-0.183,0.013l-0.116-0.14c-1.181-1.406-3.06-3.88-5.59-7.347 c-2.921-3.999-5.957-7.76-9.019-11.179l-0.139-0.155l0.409-1.238l0.275,0.017c0.881,0.048,1.568,0.074,2.06,0.074 c2.863,0,5.129-0.676,6.732-2.009c1.608-1.333,2.388-3.138,2.388-5.516c0-2.118-0.693-3.666-2.118-4.738 c-1.437-1.081-3.421-1.629-5.898-1.629c-1.695,0-3.317,0.225-4.823,0.667c-0.103,0.409-0.29,2.149-0.29,9.15v11.661l0.025,4.908 c0.016,1.868,0.068,3.086,0.149,3.625c0.102,0.656,0.235,0.865,0.288,0.925c0.064,0.074,0.249,0.218,0.764,0.357 c0.298,0.081,1.117,0.196,3.335,0.278L83.739,107l0.44,0.325v1.589l-0.417,0.41h-0.148c-0.086,0-1.596-0.052-4.533-0.153 c-1.209-0.032-2.156-0.05-2.84-0.05c-0.525,0-2.991,0.067-7.336,0.203l-0.152,0.004L68.331,108.914z'/%3E%3Cpath style='fill:%23FFFFFF;' d='M123.441,110.053c-2.372,0-4.505-0.267-6.332-0.795c-1.844-0.532-3.322-1.249-4.397-2.132 c-1.078-0.887-1.864-1.838-2.337-2.829c-0.468-0.982-0.776-2.148-0.914-3.467c-0.136-1.29-0.204-3.282-0.204-5.917v-9.671 l-0.052-4.909c-0.015-1.89-0.061-3.12-0.134-3.656c-0.089-0.655-0.218-0.864-0.268-0.923c-0.063-0.072-0.241-0.212-0.738-0.341 c-0.294-0.075-1.1-0.183-3.274-0.264l-0.127-0.006l-0.418-0.367v-1.584l0.43-0.376l0.141,0.005c4.141,0.133,6.56,0.2,7.192,0.2 c0.564,0,2.991-0.067,7.217-0.2l0.141-0.005l0.43,0.376v1.584l-0.42,0.368l-0.129,0.005c-1.145,0.033-2.038,0.083-2.655,0.148 c-0.711,0.075-1.054,0.217-1.216,0.323c-0.109,0.071-0.305,0.298-0.407,1.044c-0.089,0.66-0.134,1.598-0.134,2.785l-0.05,5.795 v8.004c0,2.615,0.055,4.556,0.162,5.773c0.106,1.192,0.334,2.205,0.678,3.015c0.337,0.791,0.858,1.483,1.55,2.055 c0.694,0.579,1.719,1.061,3.04,1.43c1.34,0.376,2.882,0.565,4.588,0.565c1.802,0,3.506-0.252,5.065-0.75 c1.533-0.49,2.711-1.203,3.503-2.121c0.791-0.921,1.319-2.152,1.567-3.666c0.257-1.559,0.385-3.764,0.385-6.552v-7.757 c0-1.308-0.022-3.107-0.063-5.396c-0.056-3.035-0.206-3.675-0.269-3.811c-0.12-0.261-0.348-0.457-0.692-0.6 c-0.265-0.107-1.074-0.246-3.434-0.286l-0.145-0.003l-0.408-0.408v-1.469l0.407-0.458l0.172,0.01c2.467,0.133,4.468,0.2,5.95,0.2 c1.264,0,3.257-0.067,5.924-0.2l0.147-0.008l0.456,0.406v1.53l-0.446,0.397l-0.132,0.003c-1.55,0.033-2.569,0.095-3.024,0.182 c-0.507,0.099-0.731,0.229-0.828,0.322c-0.141,0.136-0.25,0.366-0.327,0.681c-0.059,0.248-0.137,1.012-0.179,3.248l-0.076,5.665 v7.65c0,3.059-0.119,5.507-0.355,7.277c-0.242,1.812-0.794,3.328-1.638,4.507c-0.835,1.161-1.84,2.146-2.986,2.93 c-1.148,0.786-2.633,1.398-4.414,1.817C127.199,109.843,125.341,110.053,123.441,110.053'/%3E%3Cpath style='fill:%23FFFFFF;' d='M166.203,110.053c-6.125,0-11.175-1.767-15.012-5.255c-3.845-3.496-5.795-8.126-5.795-13.763 c0-3.881,0.972-7.326,2.893-10.234c1.917-2.905,4.483-5.109,7.629-6.551c3.129-1.434,6.693-2.16,10.588-2.16 c2.248,0,4.502,0.239,6.699,0.713c2.197,0.473,4.059,1.049,5.535,1.711l0.09,0.041l0.347,0.493l-0.075,0.182 c-0.371,0.903-0.726,3.215-1.057,6.871l-0.012,0.116l-0.36,0.411h-1.494l-0.402-0.402l-0.251-4.255 c-1.162-0.895-2.576-1.609-4.204-2.12c-1.694-0.532-3.485-0.802-5.321-0.802c-2.763,0-5.274,0.6-7.46,1.784 c-2.176,1.177-3.89,2.908-5.093,5.143c-1.208,2.245-1.821,5.038-1.821,8.304c0,3.28,0.722,6.194,2.143,8.66 c1.42,2.465,3.386,4.386,5.841,5.707c2.462,1.325,5.382,1.997,8.682,1.997c1.463,0,2.887-0.14,4.234-0.42 c1.344-0.28,2.476-0.625,3.361-1.033c0.89-0.408,1.755-0.915,2.572-1.501l0.275-0.197l0.775,0.954l-1.089,2.662l-0.119,0.06 C174.543,109.084,170.471,110.053,166.203,110.053'/%3E%3Cpath style='fill:%23FFFFFF;' d='M184.053,108.912v-1.104l0.328-0.411l0.069-0.035c1.341-0.681,1.583-0.856,1.626-0.893 c-0.012-0.042,0.118-0.694,0.23-4.151c0.092-2.794,0.139-4.956,0.139-6.423v-9.242l-0.026-5.715c0-1.238-0.016-2.245-0.05-3.021 c-0.032-0.752-0.087-1.293-0.167-1.603c-0.092-0.371-0.178-0.514-0.219-0.566c-0.048-0.057-0.15-0.145-0.378-0.231 c-0.148-0.056-0.469-0.139-1.161-0.218l-2.019-0.16l-0.413-0.361v-1.585l0.428-0.374l0.138,0.003 c5.731,0.099,9.447,0.15,11.05,0.15c5.477,0,10.423-0.052,14.698-0.15l0.19-0.004l0.333,0.466l-0.042,0.163 c-0.411,1.582-0.722,4.107-0.922,7.51l-0.006,0.109l-0.323,0.43h-1.549l-0.467-0.414l0.021-0.185 c0.014-0.136,0.022-0.256,0.022-0.364c0-1.329-0.098-2.616-0.291-3.827c-1.003-0.41-2.38-0.684-4.101-0.814 c-1.854-0.142-3.264-0.213-4.19-0.213c-1.241,0-2.833,0.082-4.738,0.247l-0.091,3.709l-0.146,9.373 c1.669,0.087,3.231,0.132,4.649,0.132c1.524,0,2.818-0.05,3.844-0.148c1.379-0.134,1.636-0.243,1.673-0.263 c0.094-0.059,0.18-0.207,0.245-0.428c0.086-0.286,0.162-0.817,0.227-1.577l0.108-1.689l0.403-0.401h1.454l0.414,0.414 l-0.003,0.152c-0.034,1.831-0.076,3.67-0.126,5.519l0.129,5.801l-0.414,0.416h-1.454l-0.396-0.396l-0.19-1.634 c-0.183-1.428-0.272-1.9-0.315-2.043c-0.043-0.147-0.15-0.277-0.325-0.399c-0.087-0.059-0.429-0.211-1.71-0.34 c-0.99-0.101-2.376-0.15-4.119-0.15c-0.916,0-2.289,0.038-4.118,0.111c-0.071,1.427-0.107,3.68-0.107,6.709 c0,3.271,0.036,5.766,0.108,7.422h4.293c4.049,0,6.613-0.05,7.621-0.148c0.93-0.092,1.829-0.309,2.674-0.646 c0.148-0.429,0.376-1.268,0.679-2.496c0.337-1.384,0.536-2.255,0.583-2.595l0.022-0.155l0.471-0.33h1.457l0.46,0.403l-0.043,0.206 c-0.145,0.704-0.291,1.96-0.434,3.734c-0.143,1.777-0.213,3.319-0.213,4.578v0.134l-0.376,0.431l-0.169-0.006 c-3.189-0.099-7.421-0.15-12.581-0.15l-6.852-0.052c-1.575,0-3.244,0.067-4.956,0.201l-0.165,0.011L184.053,108.912z'/%3E%3C/g%3E%3Cg%3E%3Cpath style='fill:%23FFFFFF;' d='M89.628,166.088l-1.251,3.124c-4.869,2.528-10.068,3.793-15.597,3.793 c-7.92,0-14.352-2.293-19.299-6.883c-4.947-4.589-7.421-10.587-7.421-17.997c0-5.105,1.234-9.564,3.702-13.381 c2.468-3.817,5.725-6.671,9.773-8.562c4.048-1.892,8.595-2.838,13.64-2.838c2.919,0,5.804,0.314,8.655,0.939 c2.851,0.628,5.231,1.377,7.141,2.251l0.231,0.335c-0.505,1.254-0.978,4.354-1.416,9.301l-0.231,0.269H86.01l-0.264-0.269 l-0.329-5.708c-1.603-1.298-3.538-2.311-5.809-3.039c-2.271-0.728-4.634-1.092-7.091-1.092c-3.708,0-7.032,0.811-9.97,2.434 c-2.941,1.623-5.221,3.974-6.847,7.052c-1.62,3.079-2.433,6.844-2.433,11.3c0,4.477,0.954,8.404,2.862,11.785 c1.909,3.382,4.515,5.977,7.815,7.79c3.3,1.813,7.157,2.72,11.567,2.72c1.952,0,3.828-0.189,5.627-0.571 c1.799-0.38,3.296-0.851,4.491-1.41c1.196-0.56,2.342-1.242,3.439-2.047L89.628,166.088z'/%3E%3Cpath style='fill:%23FFFFFF;' d='M93.747,171.912v-1.104l0.327-0.41l0.067-0.036c1.337-0.688,1.574-0.866,1.614-0.904 c-0.011-0.025,0.087-0.518,0.221-3.026c0.108-2.033,0.162-4.518,0.162-7.385v-10.804l-0.05-4.908 c-0.017-1.89-0.063-3.121-0.134-3.658c-0.09-0.655-0.218-0.863-0.269-0.921c-0.062-0.071-0.241-0.212-0.74-0.341 c-0.292-0.076-1.098-0.183-3.272-0.265l-0.127-0.006l-0.418-0.366v-1.585l0.431-0.375l0.14,0.004 c4.14,0.133,6.559,0.201,7.191,0.201c0.565,0,2.991-0.068,7.217-0.201l0.14-0.004l0.431,0.375v1.585l-0.42,0.368l-0.129,0.004 c-1.145,0.033-2.037,0.083-2.656,0.149c-0.711,0.075-1.052,0.216-1.217,0.323c-0.106,0.07-0.302,0.298-0.404,1.044 c-0.091,0.661-0.136,1.597-0.136,2.785l-0.05,5.794v11.129c0,2.783,0.017,4.726,0.05,5.831l0.115,4.01h4.791 c4.066,0,6.635-0.05,7.633-0.148c0.926-0.092,1.832-0.311,2.695-0.649c0.171-0.456,0.414-1.363,0.719-2.7 c0.442-1.949,0.523-2.444,0.532-2.565l0.011-0.147l0.436-0.388h1.534l0.4,0.457l-0.035,0.171c-0.13,0.655-0.267,1.953-0.41,3.862 c-0.143,1.911-0.213,3.478-0.213,4.656v0.148l-0.417,0.417l-0.154-0.006c-3.172-0.099-7.396-0.15-12.555-0.15l-7.357-0.052 c-1.659,0-3.377,0.067-5.107,0.201l-0.165,0.011L93.747,171.912z'/%3E%3Cpath style='fill:%23FFFFFF;' d='M160.736,172.322c-1.762-0.15-3.369-0.225-4.779-0.225c-2.777,0.085-5.566,0.159-8.353,0.227 l-0.153,0.004l-0.415-0.415v-1.606l0.408-0.409l0.144-0.003c2.296-0.041,3.138-0.146,3.441-0.227 c0.386-0.104,0.439-0.311,0.439-0.522c0-0.323-0.109-0.772-0.327-1.331l-3.005-7.453h-14.104l-2.651,6.229 c-0.466,1.107-0.702,1.915-0.702,2.402c0,0.185,0.053,0.423,0.467,0.604c0.28,0.126,1.076,0.277,3.284,0.297l0.133,0.003 l0.448,0.396v1.619l-0.42,0.423l-0.162-0.011c-2.148-0.133-4.055-0.2-5.669-0.2c-1.83,0-3.702,0.067-5.566,0.2l-0.151,0.011 l-0.459-0.409v-1.633l0.446-0.396l0.133-0.003c1.477-0.02,2.048-0.104,2.267-0.173c0.29-0.088,0.543-0.266,0.777-0.543 c0.176-0.207,0.6-0.919,1.623-3.13l2.646-5.74l6.847-15.509c1.291-3.035,2.574-6.072,3.85-9.11l0.092-0.219h2.113l12.28,28.876 c0.417,0.951,0.898,1.987,1.44,3.106c0.716,1.472,0.981,1.812,1.061,1.889c0.172,0.165,0.392,0.294,0.652,0.386 c0.187,0.066,0.68,0.148,1.964,0.168l0.145,0.003l0.409,0.409v1.606l-0.424,0.425L160.736,172.322z M146.857,157.478 l-5.787-13.902l-5.879,13.902H146.857z'/%3E%3Cpath style='fill:%23FFFFFF;' d='M166.505,171.912v-1.585l0.434-0.326l0.11-0.006c1.57-0.064,2.609-0.147,3.093-0.243 c0.572-0.115,0.778-0.241,0.849-0.307c0.067-0.06,0.196-0.236,0.307-0.742c0.095-0.435,0.151-1.364,0.168-2.76l0.051-4.307v-4.782 c-0.334-0.749-1.571-2.927-3.65-6.335l-2.215-3.6c-0.698-1.13-1.588-2.467-2.646-3.974c-1.047-1.491-1.864-2.515-2.43-3.04 c-0.677-0.629-1.035-0.824-1.216-0.875c-0.161-0.048-0.696-0.125-2.47-0.125h-0.148l-0.437-0.437v-1.354l0.413-0.412l7.385-1.227 l0.12,0.083c0.523,0.367,1.041,0.835,1.536,1.39c0.495,0.558,1.191,1.559,2.125,3.058c0.915,1.467,2.109,3.542,3.548,6.162 c1.336,2.431,2.639,4.899,3.878,7.342l2.229-3.545l2.892-4.828l5.454-9.338l0.231,0.025c0.638,0.064,1.271,0.099,1.876,0.099 c0.379,0,0.957-0.034,1.732-0.099l0.167-0.014l0.424,0.424v0.765l-0.094,0.102c-0.826,0.91-2.131,2.59-3.878,4.994 c-1.75,2.408-3.071,4.317-3.929,5.672c-0.863,1.367-1.924,3.086-3.182,5.157c-1.54,2.537-1.952,3.384-2.026,3.652 c-0.109,0.385-0.164,0.854-0.164,1.389v3.702l0.025,3.775c0.017,1.434,0.07,2.446,0.16,3.007c0.113,0.708,0.25,0.904,0.29,0.949 c0.063,0.07,0.241,0.204,0.732,0.334c0.287,0.077,1.086,0.183,3.26,0.264L181.62,170l0.435,0.326v1.585l-0.413,0.411h-0.148 c-0.084,0-1.566-0.05-4.445-0.15c-1.185-0.035-2.114-0.052-2.783-0.052c-0.53,0-2.951,0.068-7.191,0.201l-0.155,0.006 L166.505,171.912z'/%3E%3Cpath style='fill:%23FFFFFF;' d='M190.461,172.648c-0.73,0-1.434-0.193-2.089-0.568c-0.656-0.378-1.167-0.898-1.518-1.55 c-0.35-0.646-0.526-1.633-0.526-2.323c0-0.693,0.176-1.062,0.526-1.707c0.35-0.646,0.86-1.168,1.518-1.547 c0.653-0.379,1.359-0.571,2.089-0.571c0.729,0,1.422,0.186,2.06,0.554c0.638,0.365,1.147,0.877,1.517,1.519 c0.367,0.641,0.553,1.333,0.553,2.061c0,0.737-0.186,1.431-0.553,2.068c-0.367,0.636-0.877,1.146-1.511,1.511 C191.891,172.461,191.196,172.648,190.461,172.648 M190.461,165.157c-0.594,0-1.167,0.157-1.701,0.462 c-0.533,0.305-0.947,0.728-1.23,1.254c-0.284,0.531-0.43,1.083-0.43,1.644c0,0.577,0.147,1.132,0.438,1.657 c0.288,0.522,0.698,0.942,1.224,1.244c0.526,0.306,1.097,0.459,1.698,0.459c0.592,0,1.154-0.15,1.675-0.448 c0.518-0.296,0.935-0.712,1.234-1.234c0.301-0.52,0.452-1.086,0.452-1.678c0-0.599-0.151-1.163-0.452-1.679 c-0.299-0.516-0.715-0.93-1.231-1.23C191.62,165.308,191.056,165.157,190.461,165.157 M192.117,170.692 c-0.211,0-0.372-0.025-0.495-0.077c-0.133-0.055-0.252-0.169-0.354-0.34c-0.088-0.15-0.225-0.454-0.407-0.91 c-0.113-0.291-0.188-0.417-0.231-0.476c-0.056-0.073-0.115-0.126-0.175-0.157c-0.027-0.014-0.118-0.046-0.396-0.046H189.9v1.227 c0,0.221,0.016,0.276,0.018,0.281c0.021,0.018,0.063,0.038,0.225,0.038l0.288,0.011v0.448h-1.95v-0.448l0.287-0.011 c0.165,0,0.207-0.017,0.211-0.02c0.02-0.034,0.035-0.097,0.035-0.299v-3.078c0-0.234-0.024-0.29-0.024-0.291 c-0.032-0.018-0.102-0.031-0.369-0.033l-0.14-0.003v-0.456h1.942c0.269,0,0.519,0.024,0.744,0.073 c0.239,0.052,0.42,0.12,0.551,0.215c0.13,0.092,0.239,0.221,0.326,0.385c0.085,0.165,0.127,0.35,0.127,0.55 c0,0.316-0.113,0.599-0.343,0.839c-0.148,0.155-0.347,0.276-0.595,0.361c0.004,0.003,0.008,0.006,0.013,0.008 c0.105,0.081,0.207,0.197,0.306,0.355c0.092,0.146,0.21,0.378,0.35,0.694c0.178,0.406,0.276,0.549,0.318,0.598 c0.071,0.083,0.218,0.103,0.33,0.108l0.137,0.004v0.449H192.117z M190.059,168.179c0.429,0,0.747-0.067,0.939-0.204 c0.179-0.126,0.267-0.33,0.267-0.618c0-0.551-0.283-0.807-0.89-0.807h-0.316c-0.095,0-0.123,0.013-0.123,0.013 c-0.025,0.026-0.035,0.067-0.035,0.246v1.371H190.059z'/%3E%3C/g%3E%3C/g%3E%3C/svg%3E%0A)
Create Stunning Infographics for Free: A Step-by-Step Guide
Quality infographics lead to social shares, and social shares leads to increased brand awareness, and increased brand awareness leads to conversions. That’s why I laid out the 10 Commandments of Infographic Virality last month, noting that “high quality infographics are 30 times more likely to be read than text articles.”
- How to create an infographic for free
- FAQ: How can I create stunning infographics for free using a step-by-step guide?
How to Create an Infographic for Free
In response to that article, one reader left a comment asking how to create an infographic for free? This was a good question, indeed, as agencies can charge $1,000 or more to create an infographic. But a hefty price tag is no reason to miss out on the treasure trove of traffic that can come with an infographic — designing your own infographic is totally doable.
There are several sites that allow you to create your own infographic for free. The easiest site, in my opinion, is Piktochart, a site with 350,000 users. It is incredibly intuitive and user-friendly. With more than 700,000 infographics created to date, Piktochart has been praised by Forbes, TechCrunch, CMS Wire, and TechInAsia. The free version of Piktochart offers seven free themes. Users can:
- Upload photos
- Implement interactive charts and tabs
- Choose from an expansive library of customizable icons and shapes
- Link from any icon, image or text with ease
- Save creations as high-quality .jpg or .png
Piktochart also offers professional packages that offer additional themes and icons (beginning at $29 a month). Piktochart’s professional clients include: Cornell University, Harvard University, York, Red Bull and Marriott.
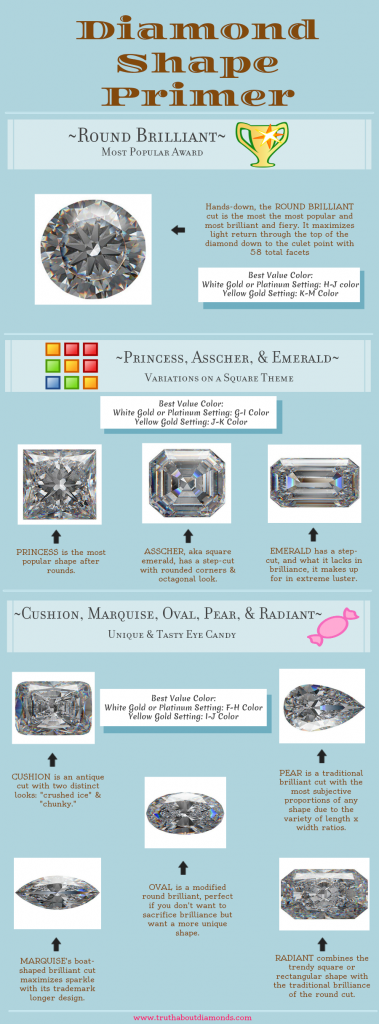
Here are some infographics that were created by individuals using Piktochart:


Piktochart is not limited to infographics alone. You can also utilize it to create other promotional materials, such as graphics for social channels.
By using Piktochart, you invest your time rather than money. This presents a great opportunity to enhance your design skills through practice. Remember to check out Piktochart’s fantastic blog, where they frequently share design tips to help you improve.
There is no ignoring it: high-quality infographics can take your social media campaigns to new heights. In a study conducted by BitRebels.com, they compared the engagement of a text-based post with an infographic presenting the same data. The results were astounding. The text-based post received 62 xeets and rexeets on X.com, while the infographic earned 578. Additionally, there was a significant jump in LinkedIn shares from 7 to 51 when the infographic was shared instead of a traditional post.
These numbers clearly demonstrate the power of infographics in engaging users and driving traffic. Companies are increasingly opting for visually compelling infographics over traditional blog-style content due to the significant improvements in sales figures and visitor numbers.
Be inspired by BitRebels and the creative community of Piktochart users, comprising 350,000 individuals who create infographics with flair and factual information. Join the party and start designing your own stunning infographics today. Don’t forget to follow the 10 Commandments of Infographic Virality to maximize your success.
If you’ve created an infographic that you are proud of, we’d love to see it in the comments below.
FAQ: How can I create stunning infographics for free using a step-by-step guide?
Creating stunning infographics is a powerful way to convey complex information visually appealingly. Whether you’re a marketer, educator, or just someone eager to share compelling data, crafting eye-catching infographics doesn’t have to come with a hefty price tag. Follow this expert guide to create visually striking infographics for free.
- Understanding Your Purpose:
Before diving into the design process, identify the purpose of your infographic. Are you aiming to simplify statistics, tell a story, or compare data? Determining your goal will shape the content and layout.
- Choose the Right Tools:
Numerous online tools offer free infographic creation services. Platforms like Canva, Piktochart, and Venngage provide user-friendly interfaces and many templates to kickstart your design journey.
- Select a Template:
Begin with a template that aligns with your infographic’s purpose. These templates act as a canvas, offering a structure that can be customized to suit your unique content.
- Data Integration:
Incorporate accurate and relevant data into your chosen template. Ensure that the information is clear, concise, and supports your overall message.
- Visual Elements:
Enhance your infographic with visually appealing elements. Icons, charts, and graphs not only add aesthetics but also help in conveying information effectively.
- Color Palette and Fonts:
Choose a cohesive color palette that complements your brand or message. Additionally, select fonts that are easy to read and maintain consistency throughout the infographic.
- Layout and Flow:
Maintain a logical flow in your infographic. Arrange elements in a way that guides the viewer’s eye from one point to another, ensuring a seamless reading experience.
- Utilize White Space:
Don’t underestimate the power of white space. It provides clarity, making your infographic less cluttered and more visually appealing.
- Review and Edit:
Before finalizing your creation, review the entire infographic. Check for spelling errors and factual inaccuracies, and ensure that the design elements align with your intended message.
- Export and Share:
Once satisfied with the design, export your infographic in a suitable format. PNG or JPEG files are commonly used for easy sharing on social media platforms or inclusion in presentations.
Creating stunning infographics for free is a feasible and enjoyable process with the right tools and techniques. Experiment, refine, and let your creativity shine through each visual element.
In the ever-evolving landscape of digital content, infographics stand out as powerful tools for effective communication. Following these steps, you can create visually stunning infographics that captivate your audience without breaking the bank. Embrace the creative process, and let your data tell a compelling story.
Step-by-Step Guide: How to Create Stunning Infographics for Free
- Define Your Purpose: Clearly outline the purpose of your infographic.
- Choose the Right Tool: Select a user-friendly platform like Canva or Piktochart.
- Pick a Template: Begin with a template that aligns with your purpose.
- Integrate Data: Input accurate and relevant data into the template.
- Add Visual Elements: Enhance your infographic with icons, charts, and graphs.
- Select Colors and Fonts: Choose a cohesive color palette and readable fonts.
- Design Layout and Flow: Arrange elements logically for a seamless flow.
- Utilize White Space: Incorporate white space for clarity and appeal.
- Review and Edit: Check for errors and ensure design alignment.
- Export and Share: Save your creation in PNG or JPEG format for easy sharing.
- Experiment and Refine: Continuously refine your design based on feedback.
- Stay Consistent: Maintain consistency in style, colors, and fonts.
- Explore Additional Tools: Experiment with additional features offered by the platform.
- Seek Feedback: Gather opinions from peers or target audience.
- Make Necessary Adjustments: Implement changes based on feedback received.
- Finalize Design: Review the infographic one last time for perfection.
- Export Final Version: Save the polished infographic for sharing.
- Share on Social Media: Share your creation across relevant platforms.
- Include in Presentations: Utilize the infographic in presentations for added impact.
- Embrace Creativity: Enjoy the process, and let your creativity shine through each visual element.
26,000+ professionals, marketers and SEOs read the Bruce Clay Blog
Subscribe now for free to get:
- Expert SEO insights from the "Father of SEO."
- Proven SEO strategies to optimize website performance.
- SEO advice to earn more website traffic, higher search ranking and increased revenue.


3 Replies to “Create Stunning Infographics for Free: A Step-by-Step Guide”
You can also use Powerpoint to create infographics. Some free Powerpoint infographic templates can be found at http://infographicb2b.com/downloads/category/powerpoint-templates/
Catherine
This is spot on! So many people are creating infographics because that’s what people want to see. Thanks for posting!
Friend and SEO Mike Wilton (https://plus.google.com/+MikeWilton/posts) had this to add on Google+:
“Word of the wise though. Stay the heck away from the HTML5 versions. We had a client try this and the graphics are totally borked in IE.”
LEAVE A REPLY

Contact Us Now.