
 --%3E%3Csvg version='1.1' id='_x3C_Layer_x3E_' xmlns='http://www.w3.org/2000/svg' xmlns:xlink='http://www.w3.org/1999/xlink' x='0px' y='0px' viewBox='0 0 234.24 234.24' style='enable-background:new 0 0 234.24 234.24;' xml:space='preserve'%3E%3Crect x='0.029' y='0.008' style='fill:%231972B9;' width='234.24' height='234.24'/%3E%3Cg%3E%3Cg%3E%3Cpath style='fill:%23FFFFFF;' d='M24.3,63.466l-0.268-0.235v-1.679l0.268-0.235c3.828,0.179,6.782,0.269,8.865,0.269 c0.782,0,5.315-0.09,10.734-0.269c1.745-0.044,3.009-0.066,3.794-0.066c3.023,0,5.417,0.301,7.186,0.905 c1.769,0.605,3.189,1.673,4.264,3.208c1.074,1.533,1.612,3.274,1.612,5.221c0,2.485-0.895,4.791-2.686,6.916 c-1.791,2.128-4.7,3.65-8.729,4.568c2.417,0.223,4.41,0.549,5.977,0.972c1.566,0.425,2.921,1.08,4.061,1.966 c1.142,0.884,2.043,2.03,2.704,3.44c0.66,1.41,0.991,3.045,0.991,4.904c0,1.454-0.225,2.933-0.672,4.433 c-0.448,1.498-1.27,2.987-2.468,4.466c-1.198,1.476-2.646,2.742-4.348,3.793c-1.701,1.052-3.441,1.815-5.222,2.283 c-1.78,0.47-3.99,0.705-6.631,0.705c-0.537,0-3.582-0.056-6.268-0.168c-2.979-0.067-4.59-0.099-4.835-0.099 c-1.523,0-3.393,0.088-5.608,0.267l-0.269-0.267v-1.109l0.269-0.334c1.298-0.583,2.048-0.986,2.249-1.21 c0.201-0.222,0.365-2.205,0.488-5.942c0.123-3.74,0.185-6.594,0.185-8.564V79.281l-0.034-7.622c0-1.657-0.022-3.006-0.067-4.046 c-0.045-1.042-0.106-1.785-0.185-2.234c-0.077-0.446-0.206-0.761-0.385-0.94s-0.431-0.329-0.756-0.453 c-0.324-0.123-0.878-0.229-1.662-0.32L24.3,63.466z M36.355,81.095c1.119,0.09,2.384,0.135,3.795,0.135 c4.633,0,9.289-0.828,11.103-2.486c1.813-1.656,2.719-3.929,2.719-6.815c0-1.679-0.347-3.106-1.042-4.283 c-0.693-1.174-1.785-2.076-3.274-2.702c-1.488-0.628-4.941-0.942-7.493-0.942c-2.081,0-3.918,0.169-5.507,0.504 c-0.202,2.015-0.302,5.529-0.302,10.543V81.095z M36.422,105.573c1.724,0.403,3.493,0.604,5.305,0.604 c3.2,0,7.142-0.515,8.954-1.543c1.814-1.031,3.15-2.458,4.013-4.283c0.861-1.825,1.293-3.811,1.293-5.96 c0-3.223-0.911-5.802-2.736-7.739c-1.824-1.937-7.202-2.904-13.27-2.904c-1.007,0-2.216,0.044-3.626,0.133v11.452L36.422,105.573z '/%3E%3Cpath style='fill:%23FFFFFF;' d='M68.331,108.914v-1.589l0.44-0.325l0.108-0.004c1.568-0.066,2.622-0.15,3.133-0.246 c0.632-0.119,0.837-0.253,0.895-0.307c0.055-0.048,0.197-0.225,0.324-0.827c0.106-0.491,0.168-1.636,0.185-3.404l0.026-5.311 v-11.66l-0.052-4.907c-0.015-1.887-0.063-3.117-0.137-3.656c-0.09-0.655-0.223-0.862-0.274-0.921 c-0.063-0.071-0.248-0.213-0.757-0.342c-0.299-0.078-1.123-0.185-3.342-0.267l-0.125-0.004l-0.425-0.366V73.19l0.439-0.375 l0.14,0.006c3.115,0.133,5.572,0.202,7.305,0.202c1.922,0,4.555-0.06,7.822-0.176c1.224-0.035,2.109-0.05,2.659-0.05 c4.473,0,7.438,0.792,9.065,2.421c1.604,1.608,2.417,3.54,2.417,5.744c0,1.464-0.395,2.921-1.177,4.327 c-0.778,1.406-1.941,2.622-3.455,3.615c-1.397,0.915-3.3,1.627-5.661,2.121c0.506,0.674,1.256,1.654,2.254,2.938l3.649,4.736 c1.182,1.562,2.449,3.208,3.799,4.946c1.728,2.22,2.318,2.742,2.516,2.857c0.357,0.204,0.659,0.33,0.9,0.374 c0.259,0.046,0.693,0.068,1.285,0.068h0.146l0.418,0.41v1.484l-0.463,0.453l-0.171-0.021c-0.804-0.099-1.775-0.15-2.885-0.15 c-1.203,0-2.533,0.05-3.956,0.151l-0.183,0.013l-0.116-0.14c-1.181-1.406-3.06-3.88-5.59-7.347 c-2.921-3.999-5.957-7.76-9.019-11.179l-0.139-0.155l0.409-1.238l0.275,0.017c0.881,0.048,1.568,0.074,2.06,0.074 c2.863,0,5.129-0.676,6.732-2.009c1.608-1.333,2.388-3.138,2.388-5.516c0-2.118-0.693-3.666-2.118-4.738 c-1.437-1.081-3.421-1.629-5.898-1.629c-1.695,0-3.317,0.225-4.823,0.667c-0.103,0.409-0.29,2.149-0.29,9.15v11.661l0.025,4.908 c0.016,1.868,0.068,3.086,0.149,3.625c0.102,0.656,0.235,0.865,0.288,0.925c0.064,0.074,0.249,0.218,0.764,0.357 c0.298,0.081,1.117,0.196,3.335,0.278L83.739,107l0.44,0.325v1.589l-0.417,0.41h-0.148c-0.086,0-1.596-0.052-4.533-0.153 c-1.209-0.032-2.156-0.05-2.84-0.05c-0.525,0-2.991,0.067-7.336,0.203l-0.152,0.004L68.331,108.914z'/%3E%3Cpath style='fill:%23FFFFFF;' d='M123.441,110.053c-2.372,0-4.505-0.267-6.332-0.795c-1.844-0.532-3.322-1.249-4.397-2.132 c-1.078-0.887-1.864-1.838-2.337-2.829c-0.468-0.982-0.776-2.148-0.914-3.467c-0.136-1.29-0.204-3.282-0.204-5.917v-9.671 l-0.052-4.909c-0.015-1.89-0.061-3.12-0.134-3.656c-0.089-0.655-0.218-0.864-0.268-0.923c-0.063-0.072-0.241-0.212-0.738-0.341 c-0.294-0.075-1.1-0.183-3.274-0.264l-0.127-0.006l-0.418-0.367v-1.584l0.43-0.376l0.141,0.005c4.141,0.133,6.56,0.2,7.192,0.2 c0.564,0,2.991-0.067,7.217-0.2l0.141-0.005l0.43,0.376v1.584l-0.42,0.368l-0.129,0.005c-1.145,0.033-2.038,0.083-2.655,0.148 c-0.711,0.075-1.054,0.217-1.216,0.323c-0.109,0.071-0.305,0.298-0.407,1.044c-0.089,0.66-0.134,1.598-0.134,2.785l-0.05,5.795 v8.004c0,2.615,0.055,4.556,0.162,5.773c0.106,1.192,0.334,2.205,0.678,3.015c0.337,0.791,0.858,1.483,1.55,2.055 c0.694,0.579,1.719,1.061,3.04,1.43c1.34,0.376,2.882,0.565,4.588,0.565c1.802,0,3.506-0.252,5.065-0.75 c1.533-0.49,2.711-1.203,3.503-2.121c0.791-0.921,1.319-2.152,1.567-3.666c0.257-1.559,0.385-3.764,0.385-6.552v-7.757 c0-1.308-0.022-3.107-0.063-5.396c-0.056-3.035-0.206-3.675-0.269-3.811c-0.12-0.261-0.348-0.457-0.692-0.6 c-0.265-0.107-1.074-0.246-3.434-0.286l-0.145-0.003l-0.408-0.408v-1.469l0.407-0.458l0.172,0.01c2.467,0.133,4.468,0.2,5.95,0.2 c1.264,0,3.257-0.067,5.924-0.2l0.147-0.008l0.456,0.406v1.53l-0.446,0.397l-0.132,0.003c-1.55,0.033-2.569,0.095-3.024,0.182 c-0.507,0.099-0.731,0.229-0.828,0.322c-0.141,0.136-0.25,0.366-0.327,0.681c-0.059,0.248-0.137,1.012-0.179,3.248l-0.076,5.665 v7.65c0,3.059-0.119,5.507-0.355,7.277c-0.242,1.812-0.794,3.328-1.638,4.507c-0.835,1.161-1.84,2.146-2.986,2.93 c-1.148,0.786-2.633,1.398-4.414,1.817C127.199,109.843,125.341,110.053,123.441,110.053'/%3E%3Cpath style='fill:%23FFFFFF;' d='M166.203,110.053c-6.125,0-11.175-1.767-15.012-5.255c-3.845-3.496-5.795-8.126-5.795-13.763 c0-3.881,0.972-7.326,2.893-10.234c1.917-2.905,4.483-5.109,7.629-6.551c3.129-1.434,6.693-2.16,10.588-2.16 c2.248,0,4.502,0.239,6.699,0.713c2.197,0.473,4.059,1.049,5.535,1.711l0.09,0.041l0.347,0.493l-0.075,0.182 c-0.371,0.903-0.726,3.215-1.057,6.871l-0.012,0.116l-0.36,0.411h-1.494l-0.402-0.402l-0.251-4.255 c-1.162-0.895-2.576-1.609-4.204-2.12c-1.694-0.532-3.485-0.802-5.321-0.802c-2.763,0-5.274,0.6-7.46,1.784 c-2.176,1.177-3.89,2.908-5.093,5.143c-1.208,2.245-1.821,5.038-1.821,8.304c0,3.28,0.722,6.194,2.143,8.66 c1.42,2.465,3.386,4.386,5.841,5.707c2.462,1.325,5.382,1.997,8.682,1.997c1.463,0,2.887-0.14,4.234-0.42 c1.344-0.28,2.476-0.625,3.361-1.033c0.89-0.408,1.755-0.915,2.572-1.501l0.275-0.197l0.775,0.954l-1.089,2.662l-0.119,0.06 C174.543,109.084,170.471,110.053,166.203,110.053'/%3E%3Cpath style='fill:%23FFFFFF;' d='M184.053,108.912v-1.104l0.328-0.411l0.069-0.035c1.341-0.681,1.583-0.856,1.626-0.893 c-0.012-0.042,0.118-0.694,0.23-4.151c0.092-2.794,0.139-4.956,0.139-6.423v-9.242l-0.026-5.715c0-1.238-0.016-2.245-0.05-3.021 c-0.032-0.752-0.087-1.293-0.167-1.603c-0.092-0.371-0.178-0.514-0.219-0.566c-0.048-0.057-0.15-0.145-0.378-0.231 c-0.148-0.056-0.469-0.139-1.161-0.218l-2.019-0.16l-0.413-0.361v-1.585l0.428-0.374l0.138,0.003 c5.731,0.099,9.447,0.15,11.05,0.15c5.477,0,10.423-0.052,14.698-0.15l0.19-0.004l0.333,0.466l-0.042,0.163 c-0.411,1.582-0.722,4.107-0.922,7.51l-0.006,0.109l-0.323,0.43h-1.549l-0.467-0.414l0.021-0.185 c0.014-0.136,0.022-0.256,0.022-0.364c0-1.329-0.098-2.616-0.291-3.827c-1.003-0.41-2.38-0.684-4.101-0.814 c-1.854-0.142-3.264-0.213-4.19-0.213c-1.241,0-2.833,0.082-4.738,0.247l-0.091,3.709l-0.146,9.373 c1.669,0.087,3.231,0.132,4.649,0.132c1.524,0,2.818-0.05,3.844-0.148c1.379-0.134,1.636-0.243,1.673-0.263 c0.094-0.059,0.18-0.207,0.245-0.428c0.086-0.286,0.162-0.817,0.227-1.577l0.108-1.689l0.403-0.401h1.454l0.414,0.414 l-0.003,0.152c-0.034,1.831-0.076,3.67-0.126,5.519l0.129,5.801l-0.414,0.416h-1.454l-0.396-0.396l-0.19-1.634 c-0.183-1.428-0.272-1.9-0.315-2.043c-0.043-0.147-0.15-0.277-0.325-0.399c-0.087-0.059-0.429-0.211-1.71-0.34 c-0.99-0.101-2.376-0.15-4.119-0.15c-0.916,0-2.289,0.038-4.118,0.111c-0.071,1.427-0.107,3.68-0.107,6.709 c0,3.271,0.036,5.766,0.108,7.422h4.293c4.049,0,6.613-0.05,7.621-0.148c0.93-0.092,1.829-0.309,2.674-0.646 c0.148-0.429,0.376-1.268,0.679-2.496c0.337-1.384,0.536-2.255,0.583-2.595l0.022-0.155l0.471-0.33h1.457l0.46,0.403l-0.043,0.206 c-0.145,0.704-0.291,1.96-0.434,3.734c-0.143,1.777-0.213,3.319-0.213,4.578v0.134l-0.376,0.431l-0.169-0.006 c-3.189-0.099-7.421-0.15-12.581-0.15l-6.852-0.052c-1.575,0-3.244,0.067-4.956,0.201l-0.165,0.011L184.053,108.912z'/%3E%3C/g%3E%3Cg%3E%3Cpath style='fill:%23FFFFFF;' d='M89.628,166.088l-1.251,3.124c-4.869,2.528-10.068,3.793-15.597,3.793 c-7.92,0-14.352-2.293-19.299-6.883c-4.947-4.589-7.421-10.587-7.421-17.997c0-5.105,1.234-9.564,3.702-13.381 c2.468-3.817,5.725-6.671,9.773-8.562c4.048-1.892,8.595-2.838,13.64-2.838c2.919,0,5.804,0.314,8.655,0.939 c2.851,0.628,5.231,1.377,7.141,2.251l0.231,0.335c-0.505,1.254-0.978,4.354-1.416,9.301l-0.231,0.269H86.01l-0.264-0.269 l-0.329-5.708c-1.603-1.298-3.538-2.311-5.809-3.039c-2.271-0.728-4.634-1.092-7.091-1.092c-3.708,0-7.032,0.811-9.97,2.434 c-2.941,1.623-5.221,3.974-6.847,7.052c-1.62,3.079-2.433,6.844-2.433,11.3c0,4.477,0.954,8.404,2.862,11.785 c1.909,3.382,4.515,5.977,7.815,7.79c3.3,1.813,7.157,2.72,11.567,2.72c1.952,0,3.828-0.189,5.627-0.571 c1.799-0.38,3.296-0.851,4.491-1.41c1.196-0.56,2.342-1.242,3.439-2.047L89.628,166.088z'/%3E%3Cpath style='fill:%23FFFFFF;' d='M93.747,171.912v-1.104l0.327-0.41l0.067-0.036c1.337-0.688,1.574-0.866,1.614-0.904 c-0.011-0.025,0.087-0.518,0.221-3.026c0.108-2.033,0.162-4.518,0.162-7.385v-10.804l-0.05-4.908 c-0.017-1.89-0.063-3.121-0.134-3.658c-0.09-0.655-0.218-0.863-0.269-0.921c-0.062-0.071-0.241-0.212-0.74-0.341 c-0.292-0.076-1.098-0.183-3.272-0.265l-0.127-0.006l-0.418-0.366v-1.585l0.431-0.375l0.14,0.004 c4.14,0.133,6.559,0.201,7.191,0.201c0.565,0,2.991-0.068,7.217-0.201l0.14-0.004l0.431,0.375v1.585l-0.42,0.368l-0.129,0.004 c-1.145,0.033-2.037,0.083-2.656,0.149c-0.711,0.075-1.052,0.216-1.217,0.323c-0.106,0.07-0.302,0.298-0.404,1.044 c-0.091,0.661-0.136,1.597-0.136,2.785l-0.05,5.794v11.129c0,2.783,0.017,4.726,0.05,5.831l0.115,4.01h4.791 c4.066,0,6.635-0.05,7.633-0.148c0.926-0.092,1.832-0.311,2.695-0.649c0.171-0.456,0.414-1.363,0.719-2.7 c0.442-1.949,0.523-2.444,0.532-2.565l0.011-0.147l0.436-0.388h1.534l0.4,0.457l-0.035,0.171c-0.13,0.655-0.267,1.953-0.41,3.862 c-0.143,1.911-0.213,3.478-0.213,4.656v0.148l-0.417,0.417l-0.154-0.006c-3.172-0.099-7.396-0.15-12.555-0.15l-7.357-0.052 c-1.659,0-3.377,0.067-5.107,0.201l-0.165,0.011L93.747,171.912z'/%3E%3Cpath style='fill:%23FFFFFF;' d='M160.736,172.322c-1.762-0.15-3.369-0.225-4.779-0.225c-2.777,0.085-5.566,0.159-8.353,0.227 l-0.153,0.004l-0.415-0.415v-1.606l0.408-0.409l0.144-0.003c2.296-0.041,3.138-0.146,3.441-0.227 c0.386-0.104,0.439-0.311,0.439-0.522c0-0.323-0.109-0.772-0.327-1.331l-3.005-7.453h-14.104l-2.651,6.229 c-0.466,1.107-0.702,1.915-0.702,2.402c0,0.185,0.053,0.423,0.467,0.604c0.28,0.126,1.076,0.277,3.284,0.297l0.133,0.003 l0.448,0.396v1.619l-0.42,0.423l-0.162-0.011c-2.148-0.133-4.055-0.2-5.669-0.2c-1.83,0-3.702,0.067-5.566,0.2l-0.151,0.011 l-0.459-0.409v-1.633l0.446-0.396l0.133-0.003c1.477-0.02,2.048-0.104,2.267-0.173c0.29-0.088,0.543-0.266,0.777-0.543 c0.176-0.207,0.6-0.919,1.623-3.13l2.646-5.74l6.847-15.509c1.291-3.035,2.574-6.072,3.85-9.11l0.092-0.219h2.113l12.28,28.876 c0.417,0.951,0.898,1.987,1.44,3.106c0.716,1.472,0.981,1.812,1.061,1.889c0.172,0.165,0.392,0.294,0.652,0.386 c0.187,0.066,0.68,0.148,1.964,0.168l0.145,0.003l0.409,0.409v1.606l-0.424,0.425L160.736,172.322z M146.857,157.478 l-5.787-13.902l-5.879,13.902H146.857z'/%3E%3Cpath style='fill:%23FFFFFF;' d='M166.505,171.912v-1.585l0.434-0.326l0.11-0.006c1.57-0.064,2.609-0.147,3.093-0.243 c0.572-0.115,0.778-0.241,0.849-0.307c0.067-0.06,0.196-0.236,0.307-0.742c0.095-0.435,0.151-1.364,0.168-2.76l0.051-4.307v-4.782 c-0.334-0.749-1.571-2.927-3.65-6.335l-2.215-3.6c-0.698-1.13-1.588-2.467-2.646-3.974c-1.047-1.491-1.864-2.515-2.43-3.04 c-0.677-0.629-1.035-0.824-1.216-0.875c-0.161-0.048-0.696-0.125-2.47-0.125h-0.148l-0.437-0.437v-1.354l0.413-0.412l7.385-1.227 l0.12,0.083c0.523,0.367,1.041,0.835,1.536,1.39c0.495,0.558,1.191,1.559,2.125,3.058c0.915,1.467,2.109,3.542,3.548,6.162 c1.336,2.431,2.639,4.899,3.878,7.342l2.229-3.545l2.892-4.828l5.454-9.338l0.231,0.025c0.638,0.064,1.271,0.099,1.876,0.099 c0.379,0,0.957-0.034,1.732-0.099l0.167-0.014l0.424,0.424v0.765l-0.094,0.102c-0.826,0.91-2.131,2.59-3.878,4.994 c-1.75,2.408-3.071,4.317-3.929,5.672c-0.863,1.367-1.924,3.086-3.182,5.157c-1.54,2.537-1.952,3.384-2.026,3.652 c-0.109,0.385-0.164,0.854-0.164,1.389v3.702l0.025,3.775c0.017,1.434,0.07,2.446,0.16,3.007c0.113,0.708,0.25,0.904,0.29,0.949 c0.063,0.07,0.241,0.204,0.732,0.334c0.287,0.077,1.086,0.183,3.26,0.264L181.62,170l0.435,0.326v1.585l-0.413,0.411h-0.148 c-0.084,0-1.566-0.05-4.445-0.15c-1.185-0.035-2.114-0.052-2.783-0.052c-0.53,0-2.951,0.068-7.191,0.201l-0.155,0.006 L166.505,171.912z'/%3E%3Cpath style='fill:%23FFFFFF;' d='M190.461,172.648c-0.73,0-1.434-0.193-2.089-0.568c-0.656-0.378-1.167-0.898-1.518-1.55 c-0.35-0.646-0.526-1.633-0.526-2.323c0-0.693,0.176-1.062,0.526-1.707c0.35-0.646,0.86-1.168,1.518-1.547 c0.653-0.379,1.359-0.571,2.089-0.571c0.729,0,1.422,0.186,2.06,0.554c0.638,0.365,1.147,0.877,1.517,1.519 c0.367,0.641,0.553,1.333,0.553,2.061c0,0.737-0.186,1.431-0.553,2.068c-0.367,0.636-0.877,1.146-1.511,1.511 C191.891,172.461,191.196,172.648,190.461,172.648 M190.461,165.157c-0.594,0-1.167,0.157-1.701,0.462 c-0.533,0.305-0.947,0.728-1.23,1.254c-0.284,0.531-0.43,1.083-0.43,1.644c0,0.577,0.147,1.132,0.438,1.657 c0.288,0.522,0.698,0.942,1.224,1.244c0.526,0.306,1.097,0.459,1.698,0.459c0.592,0,1.154-0.15,1.675-0.448 c0.518-0.296,0.935-0.712,1.234-1.234c0.301-0.52,0.452-1.086,0.452-1.678c0-0.599-0.151-1.163-0.452-1.679 c-0.299-0.516-0.715-0.93-1.231-1.23C191.62,165.308,191.056,165.157,190.461,165.157 M192.117,170.692 c-0.211,0-0.372-0.025-0.495-0.077c-0.133-0.055-0.252-0.169-0.354-0.34c-0.088-0.15-0.225-0.454-0.407-0.91 c-0.113-0.291-0.188-0.417-0.231-0.476c-0.056-0.073-0.115-0.126-0.175-0.157c-0.027-0.014-0.118-0.046-0.396-0.046H189.9v1.227 c0,0.221,0.016,0.276,0.018,0.281c0.021,0.018,0.063,0.038,0.225,0.038l0.288,0.011v0.448h-1.95v-0.448l0.287-0.011 c0.165,0,0.207-0.017,0.211-0.02c0.02-0.034,0.035-0.097,0.035-0.299v-3.078c0-0.234-0.024-0.29-0.024-0.291 c-0.032-0.018-0.102-0.031-0.369-0.033l-0.14-0.003v-0.456h1.942c0.269,0,0.519,0.024,0.744,0.073 c0.239,0.052,0.42,0.12,0.551,0.215c0.13,0.092,0.239,0.221,0.326,0.385c0.085,0.165,0.127,0.35,0.127,0.55 c0,0.316-0.113,0.599-0.343,0.839c-0.148,0.155-0.347,0.276-0.595,0.361c0.004,0.003,0.008,0.006,0.013,0.008 c0.105,0.081,0.207,0.197,0.306,0.355c0.092,0.146,0.21,0.378,0.35,0.694c0.178,0.406,0.276,0.549,0.318,0.598 c0.071,0.083,0.218,0.103,0.33,0.108l0.137,0.004v0.449H192.117z M190.059,168.179c0.429,0,0.747-0.067,0.939-0.204 c0.179-0.126,0.267-0.33,0.267-0.618c0-0.551-0.283-0.807-0.89-0.807h-0.316c-0.095,0-0.123,0.013-0.123,0.013 c-0.025,0.026-0.035,0.067-0.035,0.246v1.371H190.059z'/%3E%3C/g%3E%3C/g%3E%3C/svg%3E%0A)

5 Ways to Leverage the ‘Always-On Google Zeitgeist’: Google Trends
In its Build a Story with Trends documentation, Google calls Trends an “always-on Google zeitgeist.” Usually when a brand uses a grandiose word like zeitgeist to describe itself I can’t resist an eye roll. In this case I did something more like an eyebrow roll as it struck me like an epiphany how spot-on the word “zeitgeist” is to describe the Trends tool.
According to the Knowledge Graph (seemed like the appropriate tool to use), a zeitgeist is “a mood or spirit that defines a particular period in time as shown by the ideas and beliefs of the time.”
Said another way, it’s the perceived analysis of how people felt during a specific time based on the actions they took.
This is truly the perfect way to describe Google Trends – the fairly new tool that lets you evaluate consumer interest and sentiment over time based on analysis of relative search popularity.
In the 16 months since its christening as a standalone tool, it may have been tempting to write Google Trends off as “just” another keyword research tool, or that thing Google made to tell you which NBA player people are searching most frequently.
While, yes, you can perform keyword research with it, and, yes, it is a world of fun and can easily trick you into wasting an hour visualizing “hot searches,” these uses are only the tip of the iceberg. If you stop there you’re truly missing out.
Here’s a rundown of five strategic things you can do with Google Trends that make the tool much more than a state-by-state LeBron James peak interest analyzer.
5 Ways to Use Google Trends for Serious Business
Each and every one of these five items could be a full-length blog post unto itself; there’s that much power is packed into each of them. That said, here I’ve summarized each point relatively briefly.
Let’s not let the discussion be brief, though! Please ask questions in the comments section as you see fit.
Now, the list.
To put more strategy in my marketing strategy, I use Google Trends to…
1. Visually Weigh Campaign Options
Google Trends lets you graph the relative popularity of up to five topics or queries. This is a great way to get a sense for consumer interest in a niche market, how that interest has changed over time, how interest changes with the seasons, and whether a niche is gaining momentum or fizzling out.
The query comparison feature is a great tool to help you make more strategic, consumer-focused decisions year round, but it can be particularly helpful if you’re on the fence about a campaign direction or considering an increased focus on a niche segment.
Here’s an example: say you are a sporting goods company and you’re trying to decide whether you want to target hiking, running, climbing, rowing or boxing for your summer campaign. You sell accessories for all five sports in your store, but which do people care most about? Using Google Trends to supplement your internal data you can see at a glance that Google searchers show significantly more interest in running (red), and that the interest level is continuing to rise.
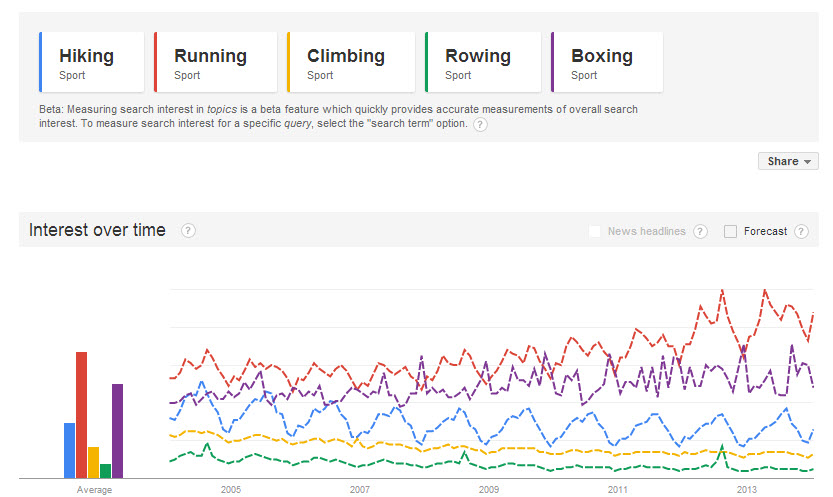
You may also be surprised to see a very high level of interest in boxing (purple), with spikes happening more frequently from 2011-2013, which could mean an increased interest in recreational participation.
If you need a quick, visual guide to get your campaign headed in one direction over another, Google Trends is an excellent data-driven resource. (And the color-coded graphs make communicating insights with stakeholders much easier.)
2. Get a More Comprehensive Idea of the Popularity of Search Concepts
Below your query selections in Google Trends you’ll see a fine-print message letting users know that Trends is measuring interest in topics – not necessarily just search terms. To glean insights about interest in a specific search term, the message tells you to make sure the “search term” category is selected.
What does this mean?
Measuring interest in topics, not queries (unless specifically designated), means that Google is clumping together several terms that it infers to mean the same thing. A clump may include questions searchers ask to find out more about the query without ever typing the exact query words. Google Trends returns all of that data, together, as part of the topic’s 1-100 relative popularity “score.” (I say score in quotation marks because I am calling the data Trends returns a score; Google has never called it that.)
The example Google software engineer Gil Ran gives is the popularity of queries like “Gwyneth Paltrow (Actress),” “Gweneth Paltrow,” “Gwen Paltro,” and “Lead actress in Iron Man” all being cumulatively considered and returned when a user enters “Gwyneth Paltrow (Actress)” into Google Trends.
Data based on topics, not individual queries, is incredibly useful because it truly helps us get a better, more complete picture of what the searcher wants when they are searching (which is what we need to know if we are looking to be there with what they need before they know they need it.) When someone types “Lead actress in Iron Man” they want info about Gwyneth Paltrow, even if they don’t say “Gwyneth Paltrow” and Google Trends has found a way to articulate that implied intent as data.
(It’s awesome.)
How do you select a topic or get query popularity by designating “search term”?
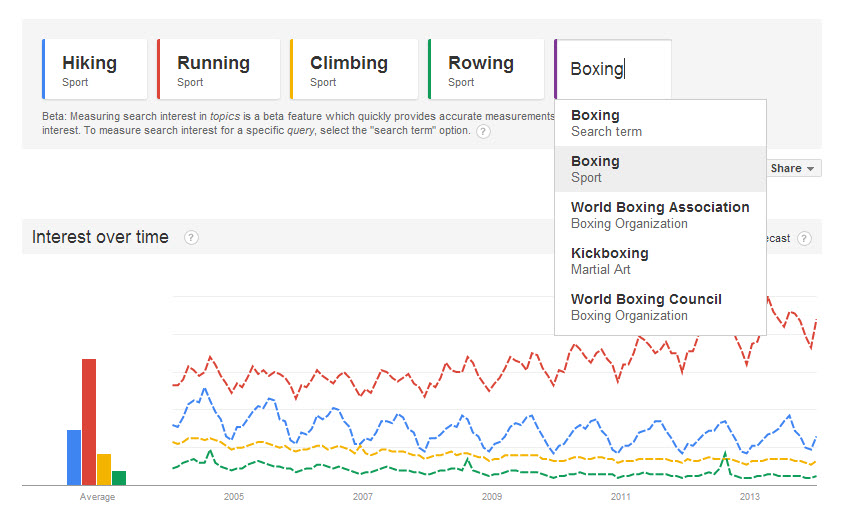
If you want to do an apples-to-apples comparison, you should make sure all your search queries pertain to the same topic – like, sports in the case of our above-mentioned hiking, running, climbing, rowing, boxing example. When you type in your query a drop-down list that offers your word in several topic contexts will automatically appear; this is Google making it easy for you to choose the right topic category. If you want to analyze the popularity of the term “boxing”, not the topic, choose “Boxing (search term).”
3. Get Specific Insights about a Term’s Connotations
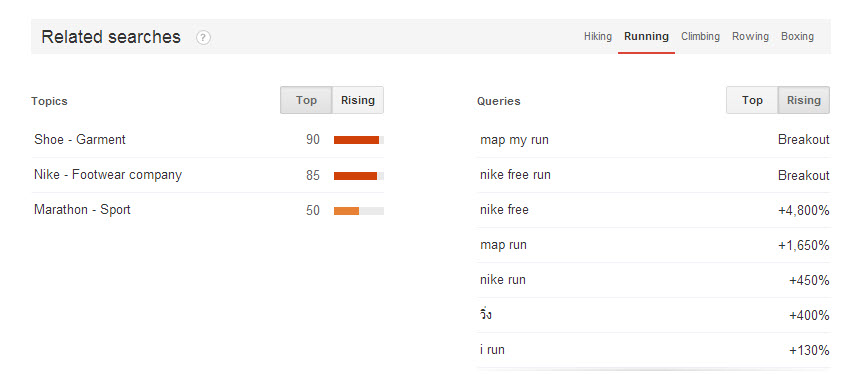
Scroll down the Google Trends search page and you will see a Related searches section with a column of Topics on the left and Queries on the right. There are two options you can choose for each list, Top and Rising. The Top option lists the most popular terms that are related to the topic you entered, while Rising shows you terms that have seen a significant increase in interest year over year (or month over month, or week over week, if you have your search narrowed to only a 30-day or 7-day period).
Both Top and Rising lists are a great way for you to get just a bit deeper into the mind of your consumer by digging just a bit deeper into their specific interests. For instance, looking at the Top topics within our Running category we see “Shoe”, “Nike” and “Marathon” – which tells us that people who are interested in the topic of running may also have a particular interest in buying Nike shoes, and that they want to know more about running marathons. This is excellent information that can lead visual campaigns (show someone running a marathon in Nike shoes to get their attention), or content marketing strategy next steps (consider writing more how-to articles about marathon running and preparation).
Looking at the Rising portion of the Queries column within the Running query we can also see that there has been an increased interest in technology that helps runners map their runs. Again, this information is great content marketing fuel, whether you take it simply to write more strategic blog content (think articles that review run mapping technology) or to propose that your company create its own branded run mapping app.
4. Leverage Trending Cultural Topics to Add a Sticky Flair to Content
Google Trends is a great resource if you want to know what shows people are watching, what celebrities they’re talking about and, in general, more about what’s trending in pop culture. This function of Google Trends might be the most fun a non-statistician can have with data, actually. That said, why are we talking about this? I thought this article was about how serious Google Trends is?
We’re talking about this because knowing what TV shows are trending is a great way to wrap your head around what TV shows people are interested in, which can be a great way to know how to get the people’s attention. The trick is to leverage what’s happening in pop culture (the start, end or re-release of a TV show, for instance) to add a sticky spin to your content marketing efforts.
HubSpot does this really well and got it particularly right with their article, “What the Arrested Development Re-Launch Tells Us About the Future of Mass Media.”

As Mary Poppins said, a spoon full of sugar makes the medicine go down, and a dash of pop culture makes the marketing tutorial less dry.
5. Visual Data Makes It Easier to Parse Opportunity and Learn from Off-Season Spikes
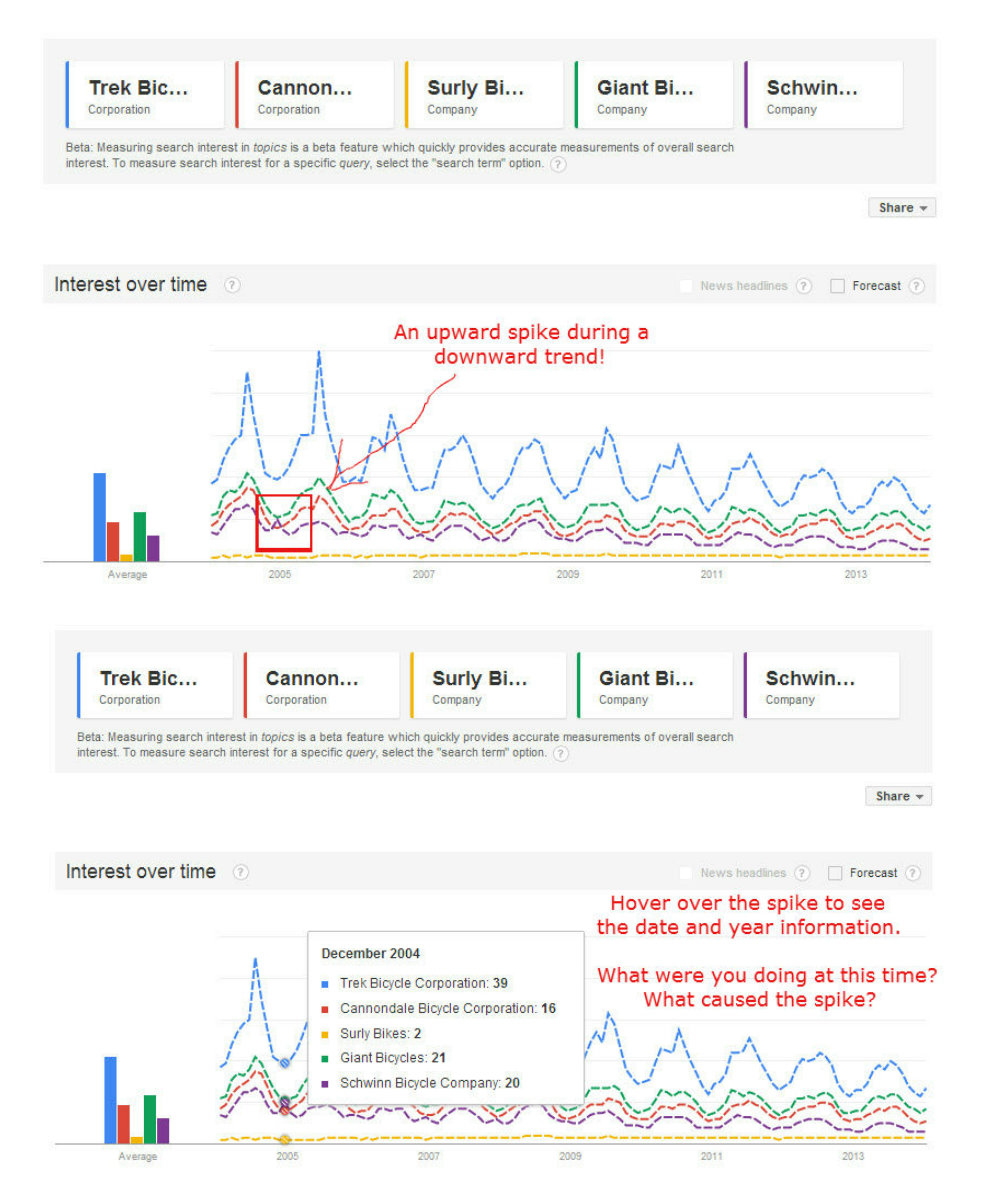
As you look at more and more of these Google Trends graphs you’ll start to see that usually companies and topics have a natural ebb and flow as the seasons progress. For instance, like clockwork, there is always a major spike in queries for bike companies like Trek, Cannondale, Giant and Schwinn in July, a smaller spike slightly earlier in April or May, and a plummet in December.
Because Google Trends displays all of its data in color-coded line graphs, seasonal changes like these are incredibly easy to parse at a glance. This visual representation of data also makes it easier to pick out historical spikes and changes in places where they don’t usually happen.
Looking for these off-season spikes is kind of like looking for a needle in a haystack, but if you see one, hop on it! Hover your mouse over the unnatural spike to see what month and year the spike happened in, then do some in-house research to get an idea of what you were doing at that time. Were you running any special campaigns during that month and year? Did you host or sponsor any events? Was there an external event or some press coverage that could have caused a heightened interest in your brand? Could this be a spike from negative media coverage?
Sometimes it will be obvious what was happening at that time with little effort; sometimes this back-story search will take more work. The key is to try to learn from what happened at that time because, whatever happened, it worked – it caused your consumers to adjust their normal routine and heighten their interest in your brand when they wouldn’t have done so otherwise. Learn from this spike and, if the spike was caused by something positive, try to reproduce it – and the spike – if you can.
Google Trends: Your Wacky, Fun Friend Who’s Actually Really Smart
Let’s recap:
Can you glean insight about keyword popularity using Google Trends? Yes! Can you look at sentiment for LeBron James state-by-state? Yes! Is that all you can do? No!
Google Trends is an excellent marketing tool that helps you get just an inch or so further into the minds of your consumers and their preferences. While it will give you data on keyword research, it’s the tool’s ability to return topic insights, shed light on trending cultural interests and visualize data in ways that make insights easier to parse, making it far more than “just” a keyword research tool.
I don’t expect you to use Google Trends data as a replacement for the insights you glean from Google Analytics, traditional keyword research or any other consumer data flow you have coming in. In fact, I would highly advise against it.
Instead, regard and use Google Trends as a supplemental marketing tool that effectively gives marketers a relevant, big-picture sense of a topic’s past, present and future popularity – all wrapped up in a visually engaging, easy to understand package.
Or, if you can’t shake the idea of Trends as the guy who’s wearing the lampshade on his head at the Google tools party, I encourage you to think about it like a wacky, fun friend who’s actually really smart. Google Trends has no problem talking about popular celebrity breakups for a couple hours if that’s what you feel like doing. But he also knows how to get down to business when it’s time.
For even more great ways in which Google Trends can enhance your search marketing techniques, check out our 5 Enlightened Ways to Use Google Trends for Keyword Research post!
26,000+ professionals, marketers and SEOs read the Bruce Clay Blog
Subscribe now for free to get:
- Expert SEO insights from the "Father of SEO."
- Proven SEO strategies to optimize website performance.
- SEO advice to earn more website traffic, higher search ranking and increased revenue.


One Reply to “5 Ways to Leverage the ‘Always-On Google Zeitgeist’: Google Trends”
Google Trends is a tool that every online marketer is supposed to checkout. This tool reveals the mind of the searchers and what they are most interested in at the moment.
There are lots of ways to leverage this tool and I bet this post has just described the most practical ones. Its a helpful post and I am sure many marketers would find good marketing campaign ideas after utilizing this tool.
LEAVE A REPLY

Contact Us Now.


